The Problem
Kubernetes dashboards are either too heavy (Lens requires a local install and feels like an IDE), too minimal (the default dashboard is barely readable), or too opinionated for teams that just need a clear, browser-based view of what's happening in their cluster right now.
The gap: a zero-configuration, browser-native dashboard that works with any cluster, gives you a real health signal - not just green/yellow/red - and ships as a single Docker image.
The Solution
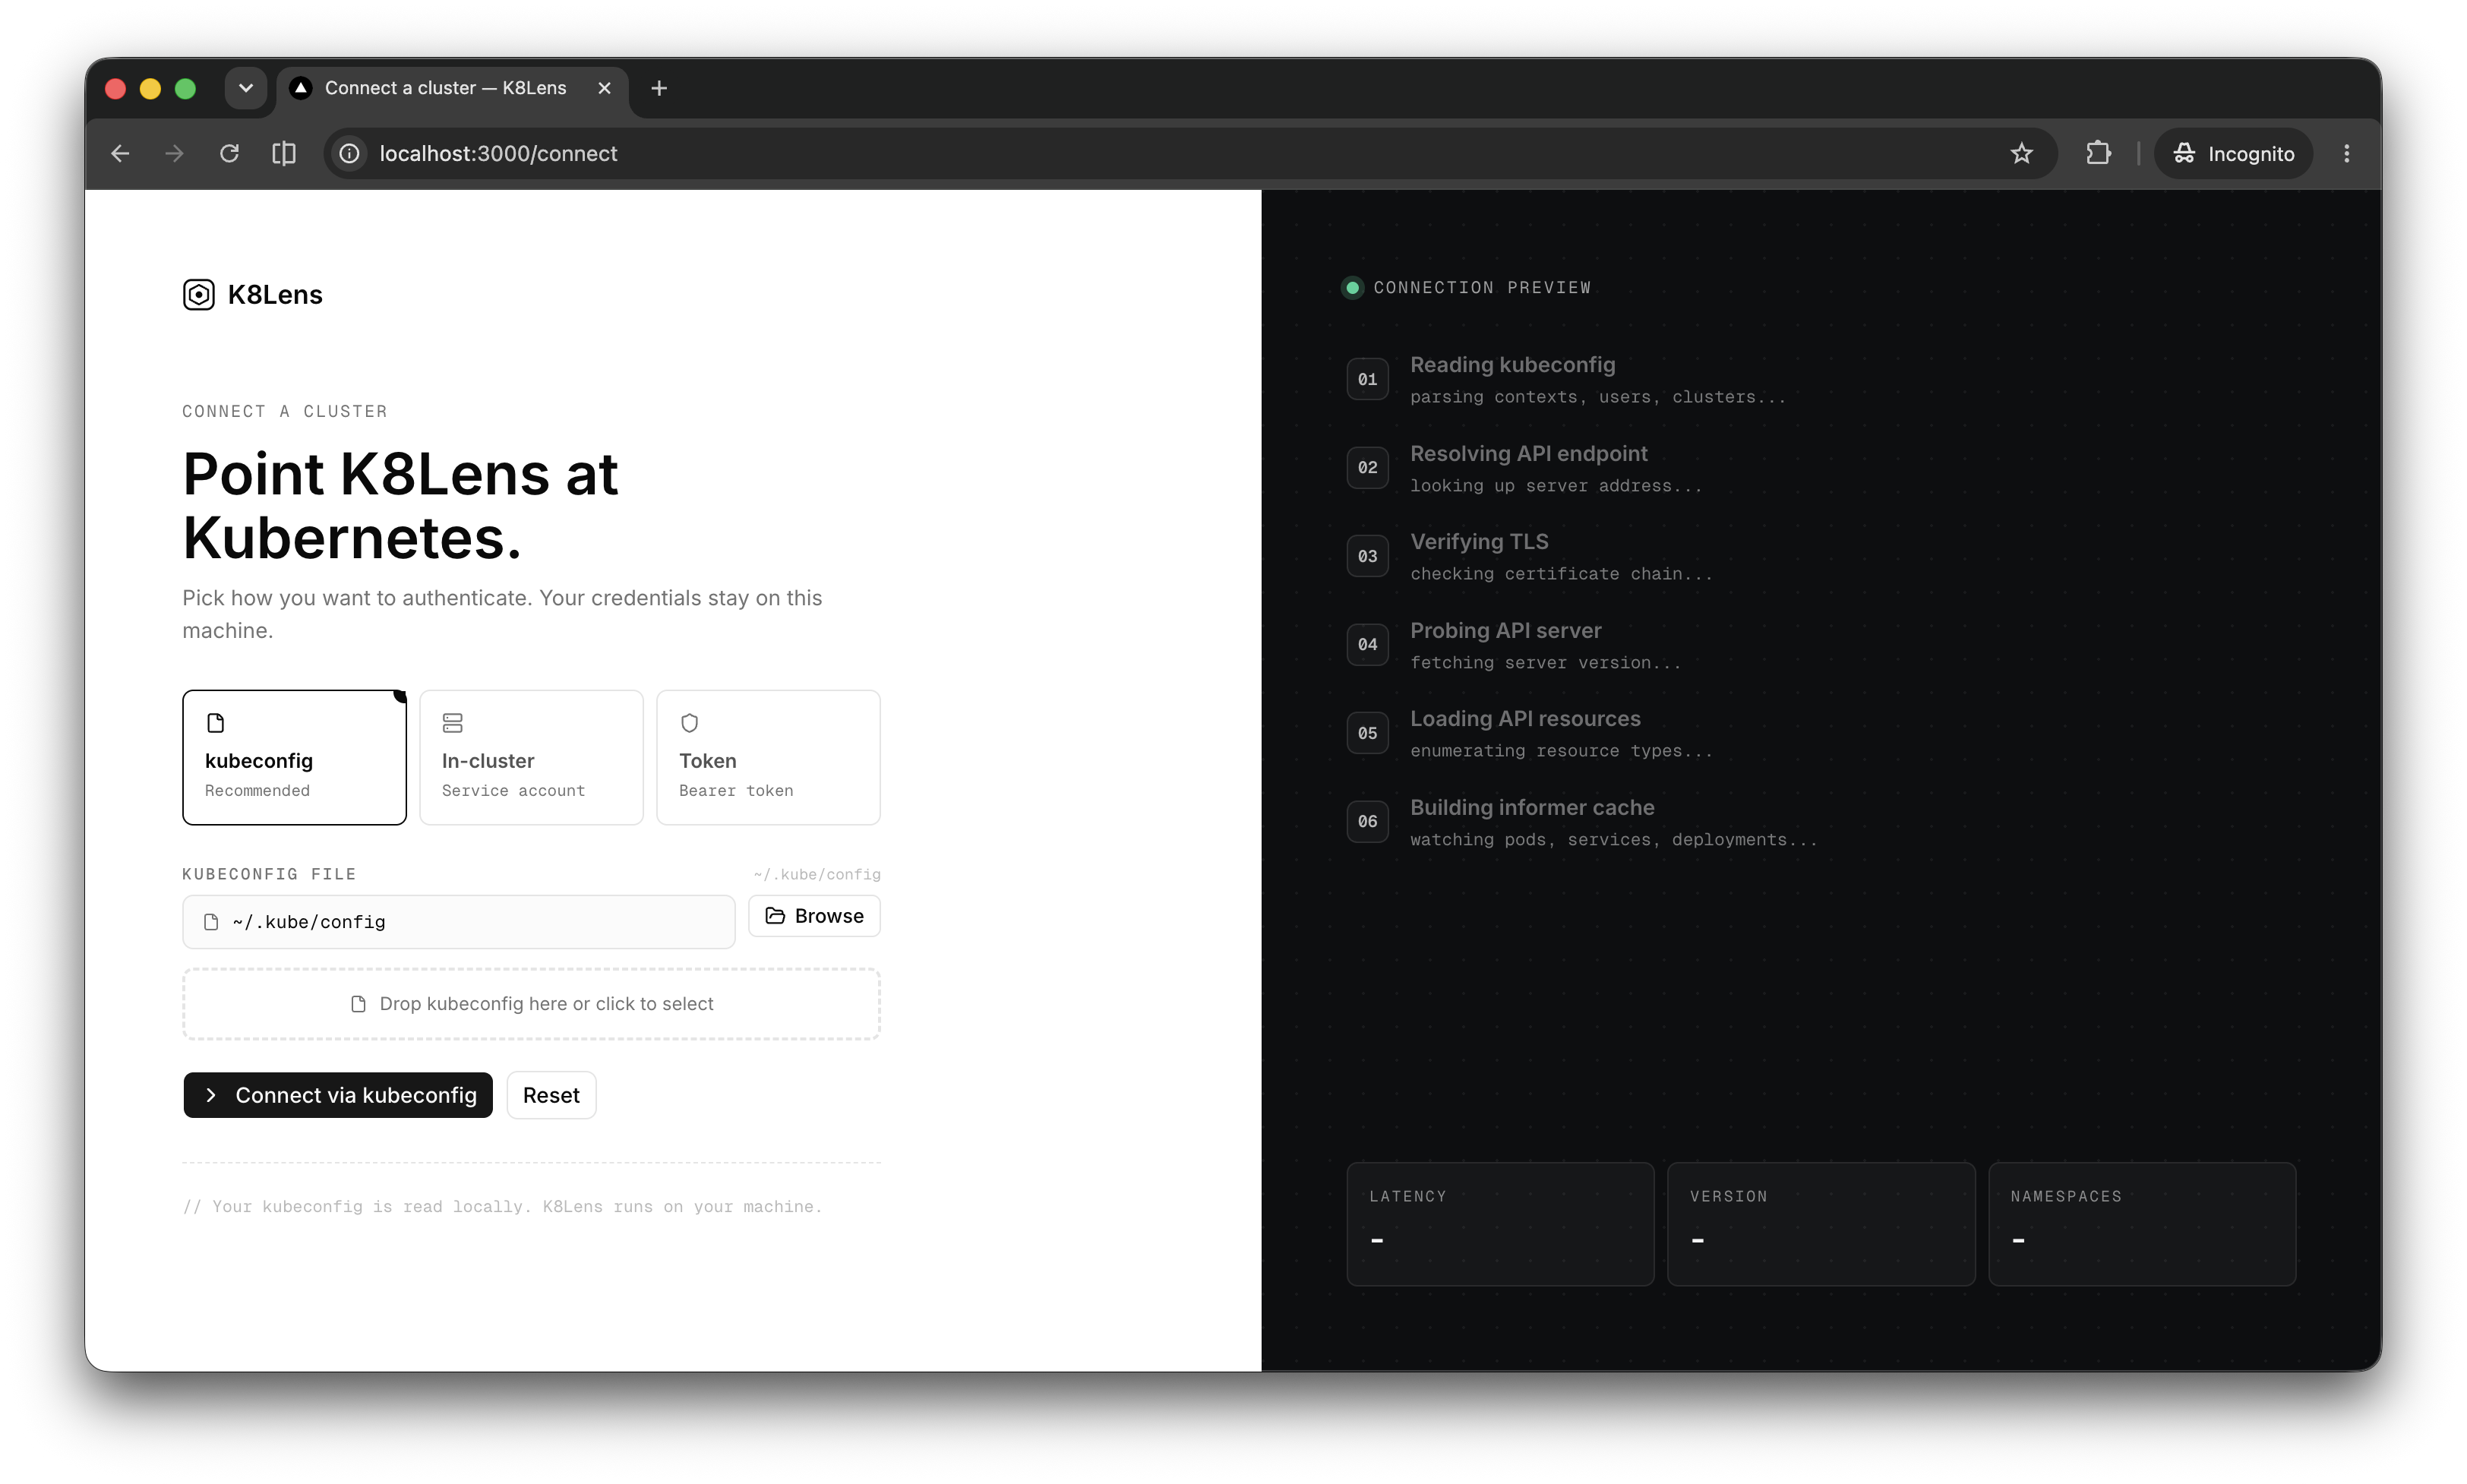
K8Lens is a production-ready web dashboard that you deploy in one Docker command. Mount your kubeconfig, or pass a URL and bearer token - the dashboard connects, pulls live cluster data across 15+ resource types, and scores cluster health on an intelligent 0–100 scale with per-category breakdown.
No local installation. No setup wizard. No agent to deploy inside the cluster.
Key Features
| Feature | Detail |
|---|---|
| Zero Configuration | Mount existing kubeconfig - works immediately with no setup required |
| 0–100 Health Score | Five-dimensional scoring: node health, pod status, workload conditions, recent events, configuration quality |
| 15+ Resource Types | Real-time monitoring across pods, services, ingresses, PVCs, RBAC, storage, and more |
| Real-Time Monitoring | Auto-refreshing live data via Next.js Server Actions |
| 8 KPI Cards | At-a-glance critical metrics on the main dashboard |
| Dual Auth | Kubeconfig file mount and URL + bearer token - flexible for any deployment scenario |
| Multi-Arch Docker Image | linux/amd64 + linux/arm64 - runs on both x86 servers and Graviton/Apple Silicon |
| Optimized Image | ~200MB Alpine-based image with non-root user and read-only kubeconfig mount |
Full Resource Coverage
Pods · Deployments · StatefulSets · DaemonSets · Jobs · CronJobs · ReplicaSets · Services · Ingresses · Endpoints · NetworkPolicies · ConfigMaps · Secrets · PersistentVolumes · PersistentVolumeClaims · StorageClasses · Roles · RoleBindings · ClusterRoles · ServiceAccounts · Nodes · Namespaces · Events
Technical Architecture
Stack: Next.js 16 · React 19 · @kubernetes/client-node · Tailwind CSS · shadcn/ui · Recharts · Docker (Alpine) · Kubernetes RBAC
Key Design Decisions
Official Kubernetes Client
Built on @kubernetes/client-node - the official, type-safe Kubernetes JavaScript client. This ensures correct RBAC handling, long-term API compatibility, and reliable behavior across Kubernetes versions.
Next.js Server Actions for Cluster Communication
All Kubernetes API calls happen server-side via Next.js Server Actions - no separate backend service needed. Kubeconfig credentials never reach the browser. The architecture stays lean: one container, one command.
Intelligent 0–100 Health Scoring
The score is calculated across five weighted dimensions:
| Dimension | What's Evaluated |
|---|---|
| Node Health | Are all nodes in Ready state? |
| Pod Health | Running vs. Failed / Pending / CrashLoopBackOff ratios |
| Workload Health | Deployment and StatefulSet desired vs. available replicas |
| Recent Events | Warning and Error event frequency in the last window |
| Configuration Quality | Resource quotas, limit ranges, namespace hygiene |
Each dimension has specific deduction rules. A cluster with all nodes Ready but 30% of pods in CrashLoopBackOff won't score 100 - and the breakdown tells you exactly why. This replaces vague status indicators with an actionable number.
Multi-Arch Docker Build
Built with Docker Buildx for linux/amd64 and linux/arm64 targets - meaning it runs natively on AWS Graviton instances, Apple Silicon development machines, and standard x86 servers without emulation overhead.
Security-Hardened Image
Multi-stage Alpine build keeps the image at ~200MB. Non-root user execution and read-only kubeconfig volume mount minimize the container's attack surface in production environments.
Development Process
- Architecture planning - Designed zero-config setup, dual auth model, and health scoring dimensions based on Kubernetes operational experience
- Core dashboard - Built main dashboard with 8 KPI cards and real-time data via Server Actions; implemented all 15+ resource type views
- Health scoring - Developed and tuned the 0–100 algorithm with per-category deduction logic; tested against clusters in various degraded states
- Auth & security - Implemented kubeconfig and URL/token auth paths; hardened container with non-root execution and read-only mounts
- Docker & publishing - Multi-stage Alpine build, Buildx for multi-arch, health checks, published to Docker Hub with quickstart documentation
Quick Start
docker run -d -p 3000:3000 \
  -v ~/.kube/config:/home/nextjs/.kube/config:ro \
  undeatharva/k8s-web-manager:latest
Open http://localhost:3000 - full cluster dashboard, no further configuration.
Impact & Takeaway
The 0–100 health score is the core differentiator. Most dashboards show you what's happening; this one tells you how healthy your cluster is - with the specificity to act on it. Combined with zero-config deployment and multi-arch support (including Graviton, which is increasingly common in cost-optimized AWS environments), the dashboard works well in exactly the environments where operational overhead should be lowest.
One Docker command. Full cluster visibility across 15+ resource types. Intelligent health scoring that tells you why.
Tags: Kubernetes dashboard · kubectl alternative · cluster management · Kubernetes monitoring · pod management · real-time dashboards · Kubernetes UI · cluster health · container orchestration