The Problem
Traefik is a powerful, widely-used reverse proxy - but its built-in dashboard is functional rather than delightful. For developers who self-host and run Traefik as a core piece of their infrastructure, there was no clean, modern interface for monitoring routers, services, middlewares, and entrypoints without modifying live configuration.
The gap: a read-only, premium-quality dashboard that just shows you what's happening - clearly, on any device, with no risk of accidental config changes.
The Solution
Traefik Dashboard is a clean, modern, read-only monitoring interface for Traefik reverse proxy. It connects to any Traefik API endpoint (local or remote), visualizes all running configuration, and adds a layer of operational awareness that the default UI lacks - including automatic release version checking.
The guiding principle: observe everything, change nothing.
Key Features
| Feature | Detail |
|---|---|
| Real-Time Visibility | Live overview of routers, services, middlewares, and entrypoints - each with dedicated filtered views |
| Version Checker | Automatically queries GitHub for new Traefik releases; alerts you with what's changed and what action to take |
| Custom Endpoint Config | Set your own Traefik API URL in Settings; supports local and remote instances with persistent storage |
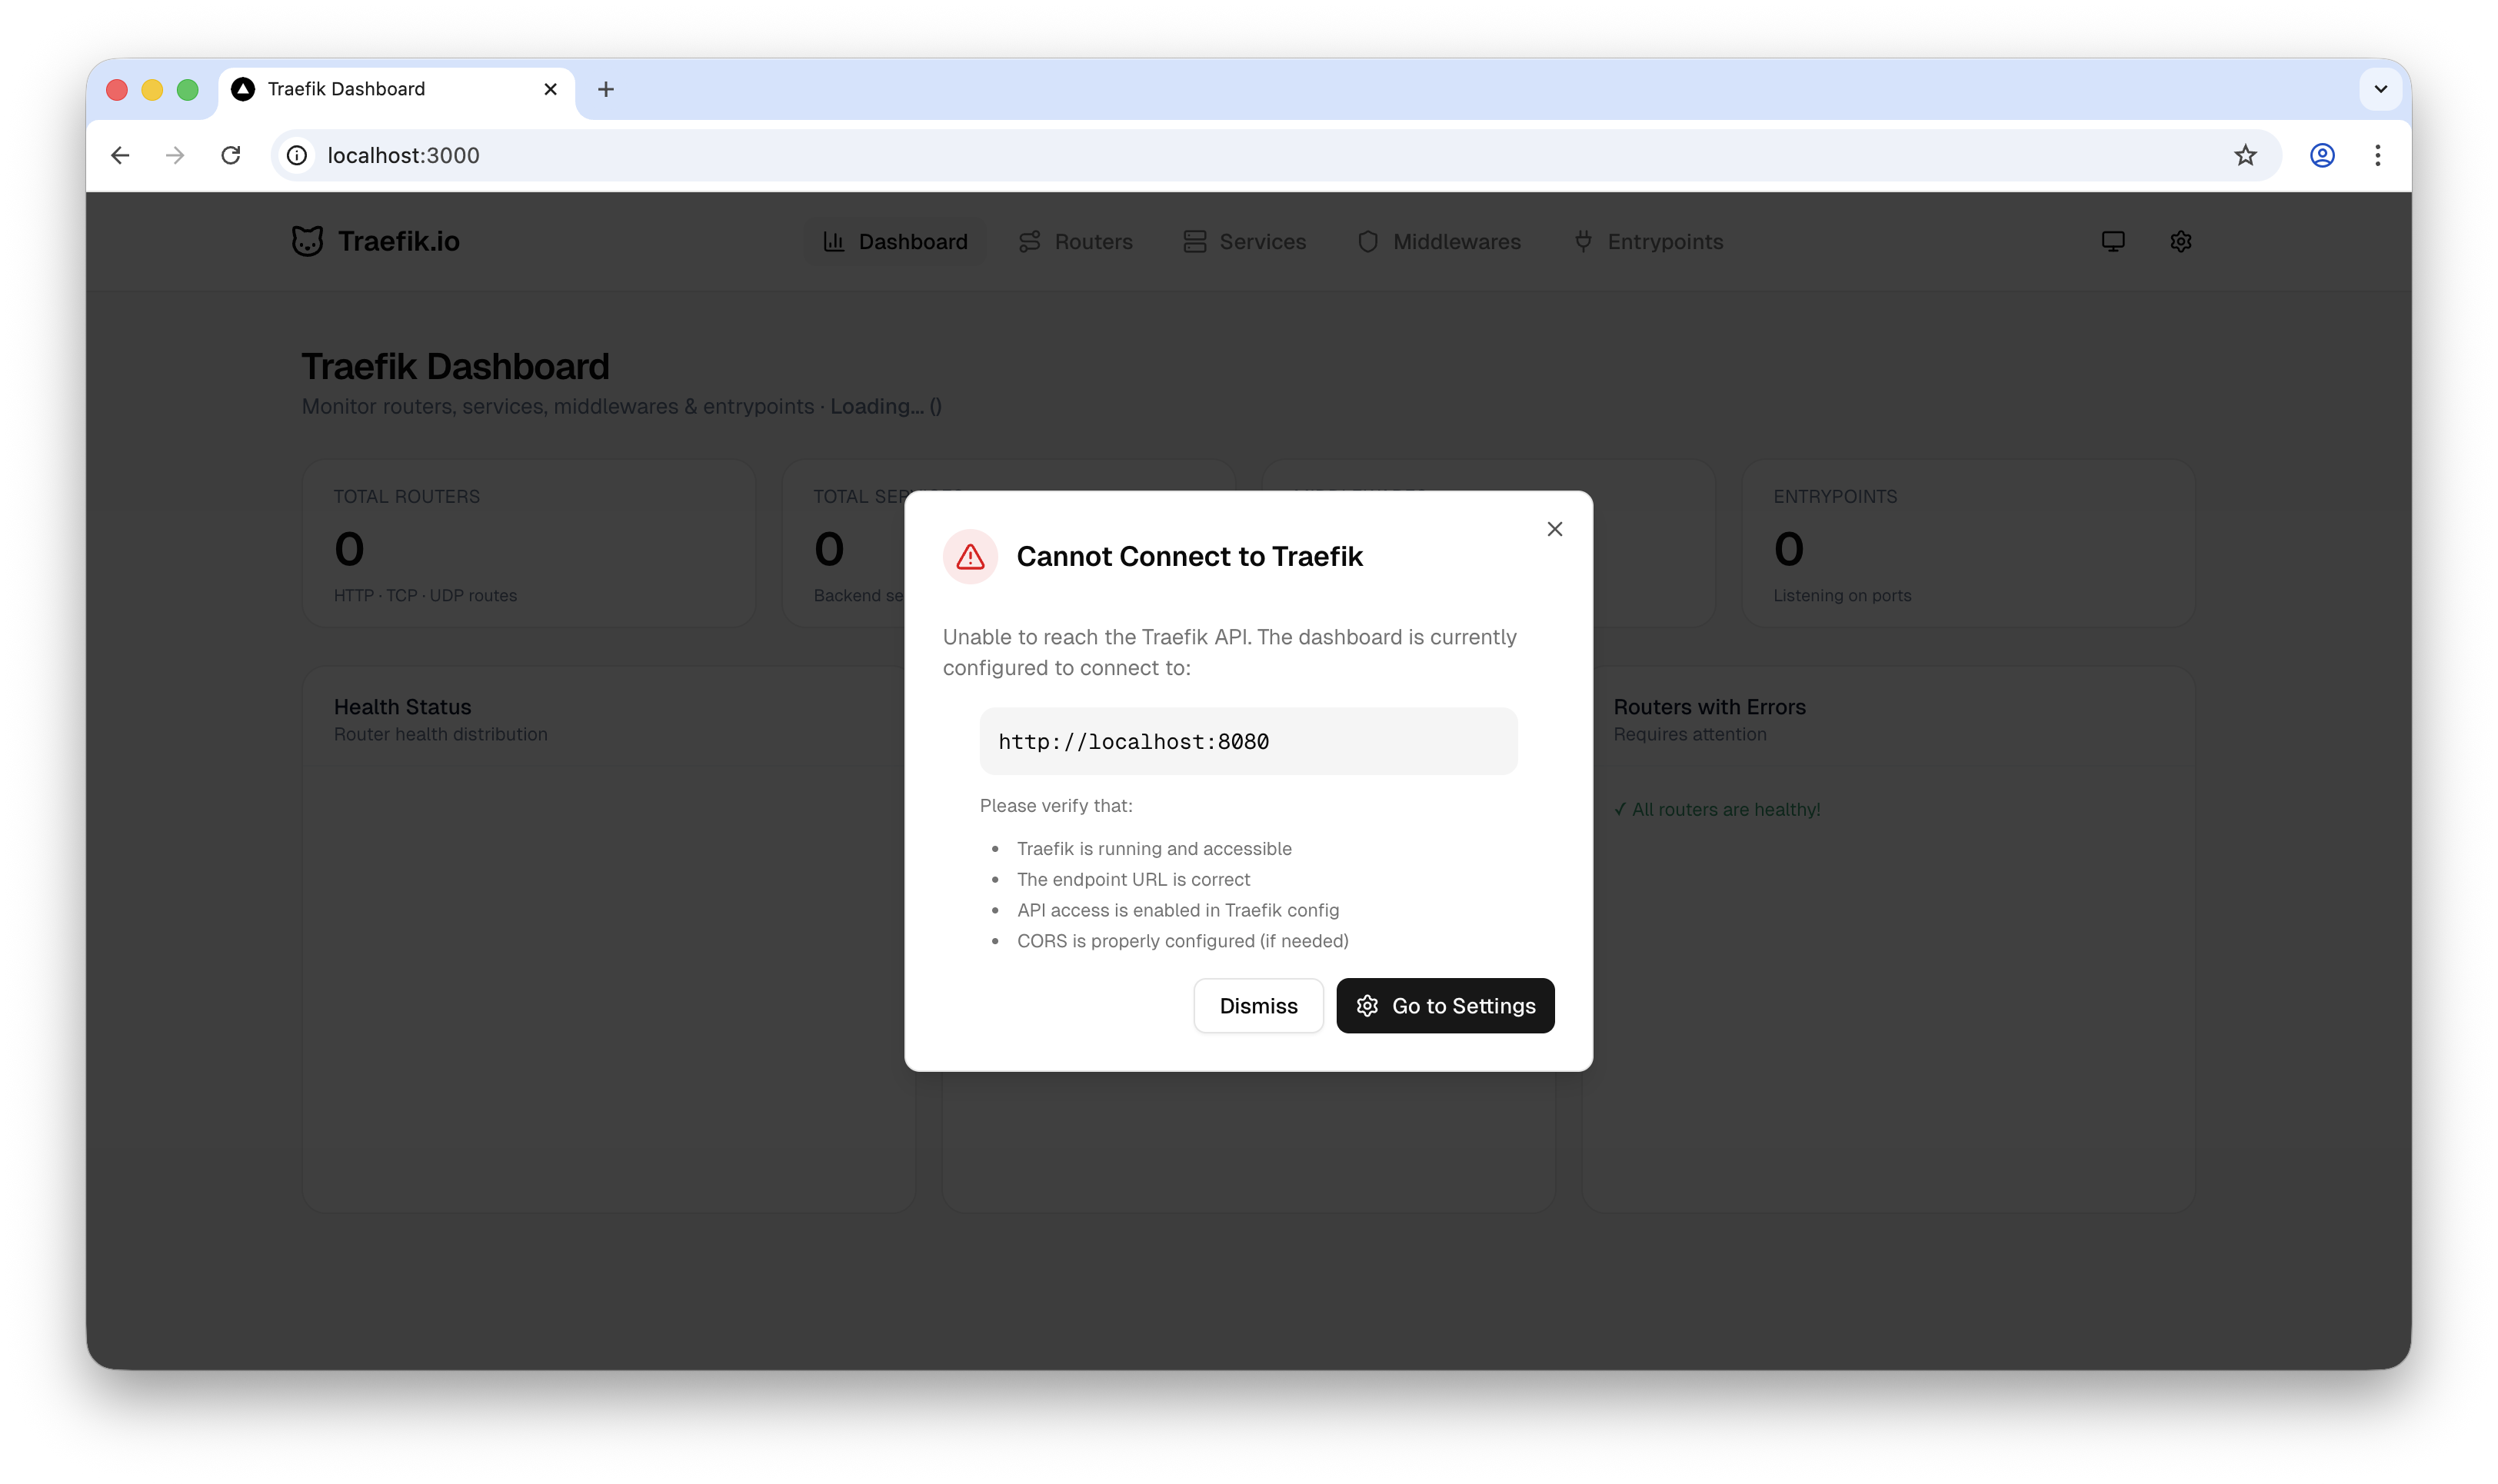
| Smart Error Handling | Detects unreachable servers, surfaces toast alerts, and auto-recovers when connection is restored |
| Dark / Light Mode | Polished toggle with smooth transitions - works beautifully in both themes |
| Fully Responsive | Optimized for both desktop and mobile; check your Traefik status from anywhere |
Technical Architecture
Stack: Next.js 16 · React 19 · Tailwind CSS v4 · shadcn/ui · Recharts · Zustand · Axios · Sonner
Key Design Decisions
Next.js API Routes as a Proxy Layer
Rather than exposing the Traefik API directly to the browser (which raises CORS and security concerns), all Traefik API calls are proxied through Next.js API routes. This keeps the architecture clean and allows endpoint configuration to live server-side.
Zustand for Lightweight Global State
Zustand manages the user's configured Traefik endpoint and UI preferences (theme, etc.) without the overhead of a heavier state library. Persistent storage is handled via a custom middleware layer.
Tailwind CSS v4
One of the first projects to adopt Tailwind v4's new engine - faster build times, improved CSS variable integration, and more expressive utility classes throughout the dark/light mode implementation.
Automatic Version Checking
The dashboard polls the Traefik GitHub releases API and compares the running version with the latest available. If a newer version exists, a dismissible popup surfaces with release notes context - a small feature with outsized operational value for self-hosters.
Development Process
- Traefik API Research - Studied the full Traefik API surface, identified the most operationally valuable data points, and designed the dashboard information architecture.
- Core Dashboard Development - Built the main dashboard with App Router, integrated the Traefik API, and created dedicated pages for all four resource types.
- Version Checking System - Built the GitHub release polling mechanism with version comparison logic and alert UX.
- UI/UX Polish - Implemented dark/light mode, responsive layouts, filtering and search, and smooth animations throughout using shadcn/ui and Tailwind CSS v4.
- Error Handling & Settings - Added smart connection error detection, Sonner toast notifications, and a Settings page for persistent endpoint configuration.
Impact & Takeaway
Traefik Dashboard fills a real gap in the self-hosting ecosystem - a monitoring interface that matches the quality of the tools it monitors. The focus on read-only design was a deliberate product decision: operators need a safe place to see without risk of touching.
The automatic version checker turns a passive dashboard into an active operational tool - a small addition that dramatically increases its day-to-day utility.
Open-sourced for the Traefik community. Monitor everything. Change nothing.
Tags: Traefik dashboard · reverse proxy management · API gateway · service mesh · load balancing · middleware configuration · SSL/TLS management · Traefik monitoring · infrastructure dashboard